🔎 Admin console: Reports
Utilize reports to create and maintain a more efficient and cost-effective print fleets in both single- or multiple-vendor print environments. Use reports along with Job Logs and Activity Logs to learn everything you could ever want to know about your print environment.
Visualize your most important information
PaperCut Hive and Pocket Reports offer a unified and detailed perspective of your printers’ activities. Reports allow you to:
- easily comprehend your print, scan, copy, and fax operations
- visualize important metrics
- explore specific devices, users, and print jobs.
With that wealth of information to hand, you can:
- evaluate your organization’s activities at your printers
- gain valuable insights into your users
- examine the environmental impact of your business operations.
Revealing this crucial information about your users and printers can help you identify inefficiencies, opportunities to tweak usage policies, and potential cost-saving opportunities.
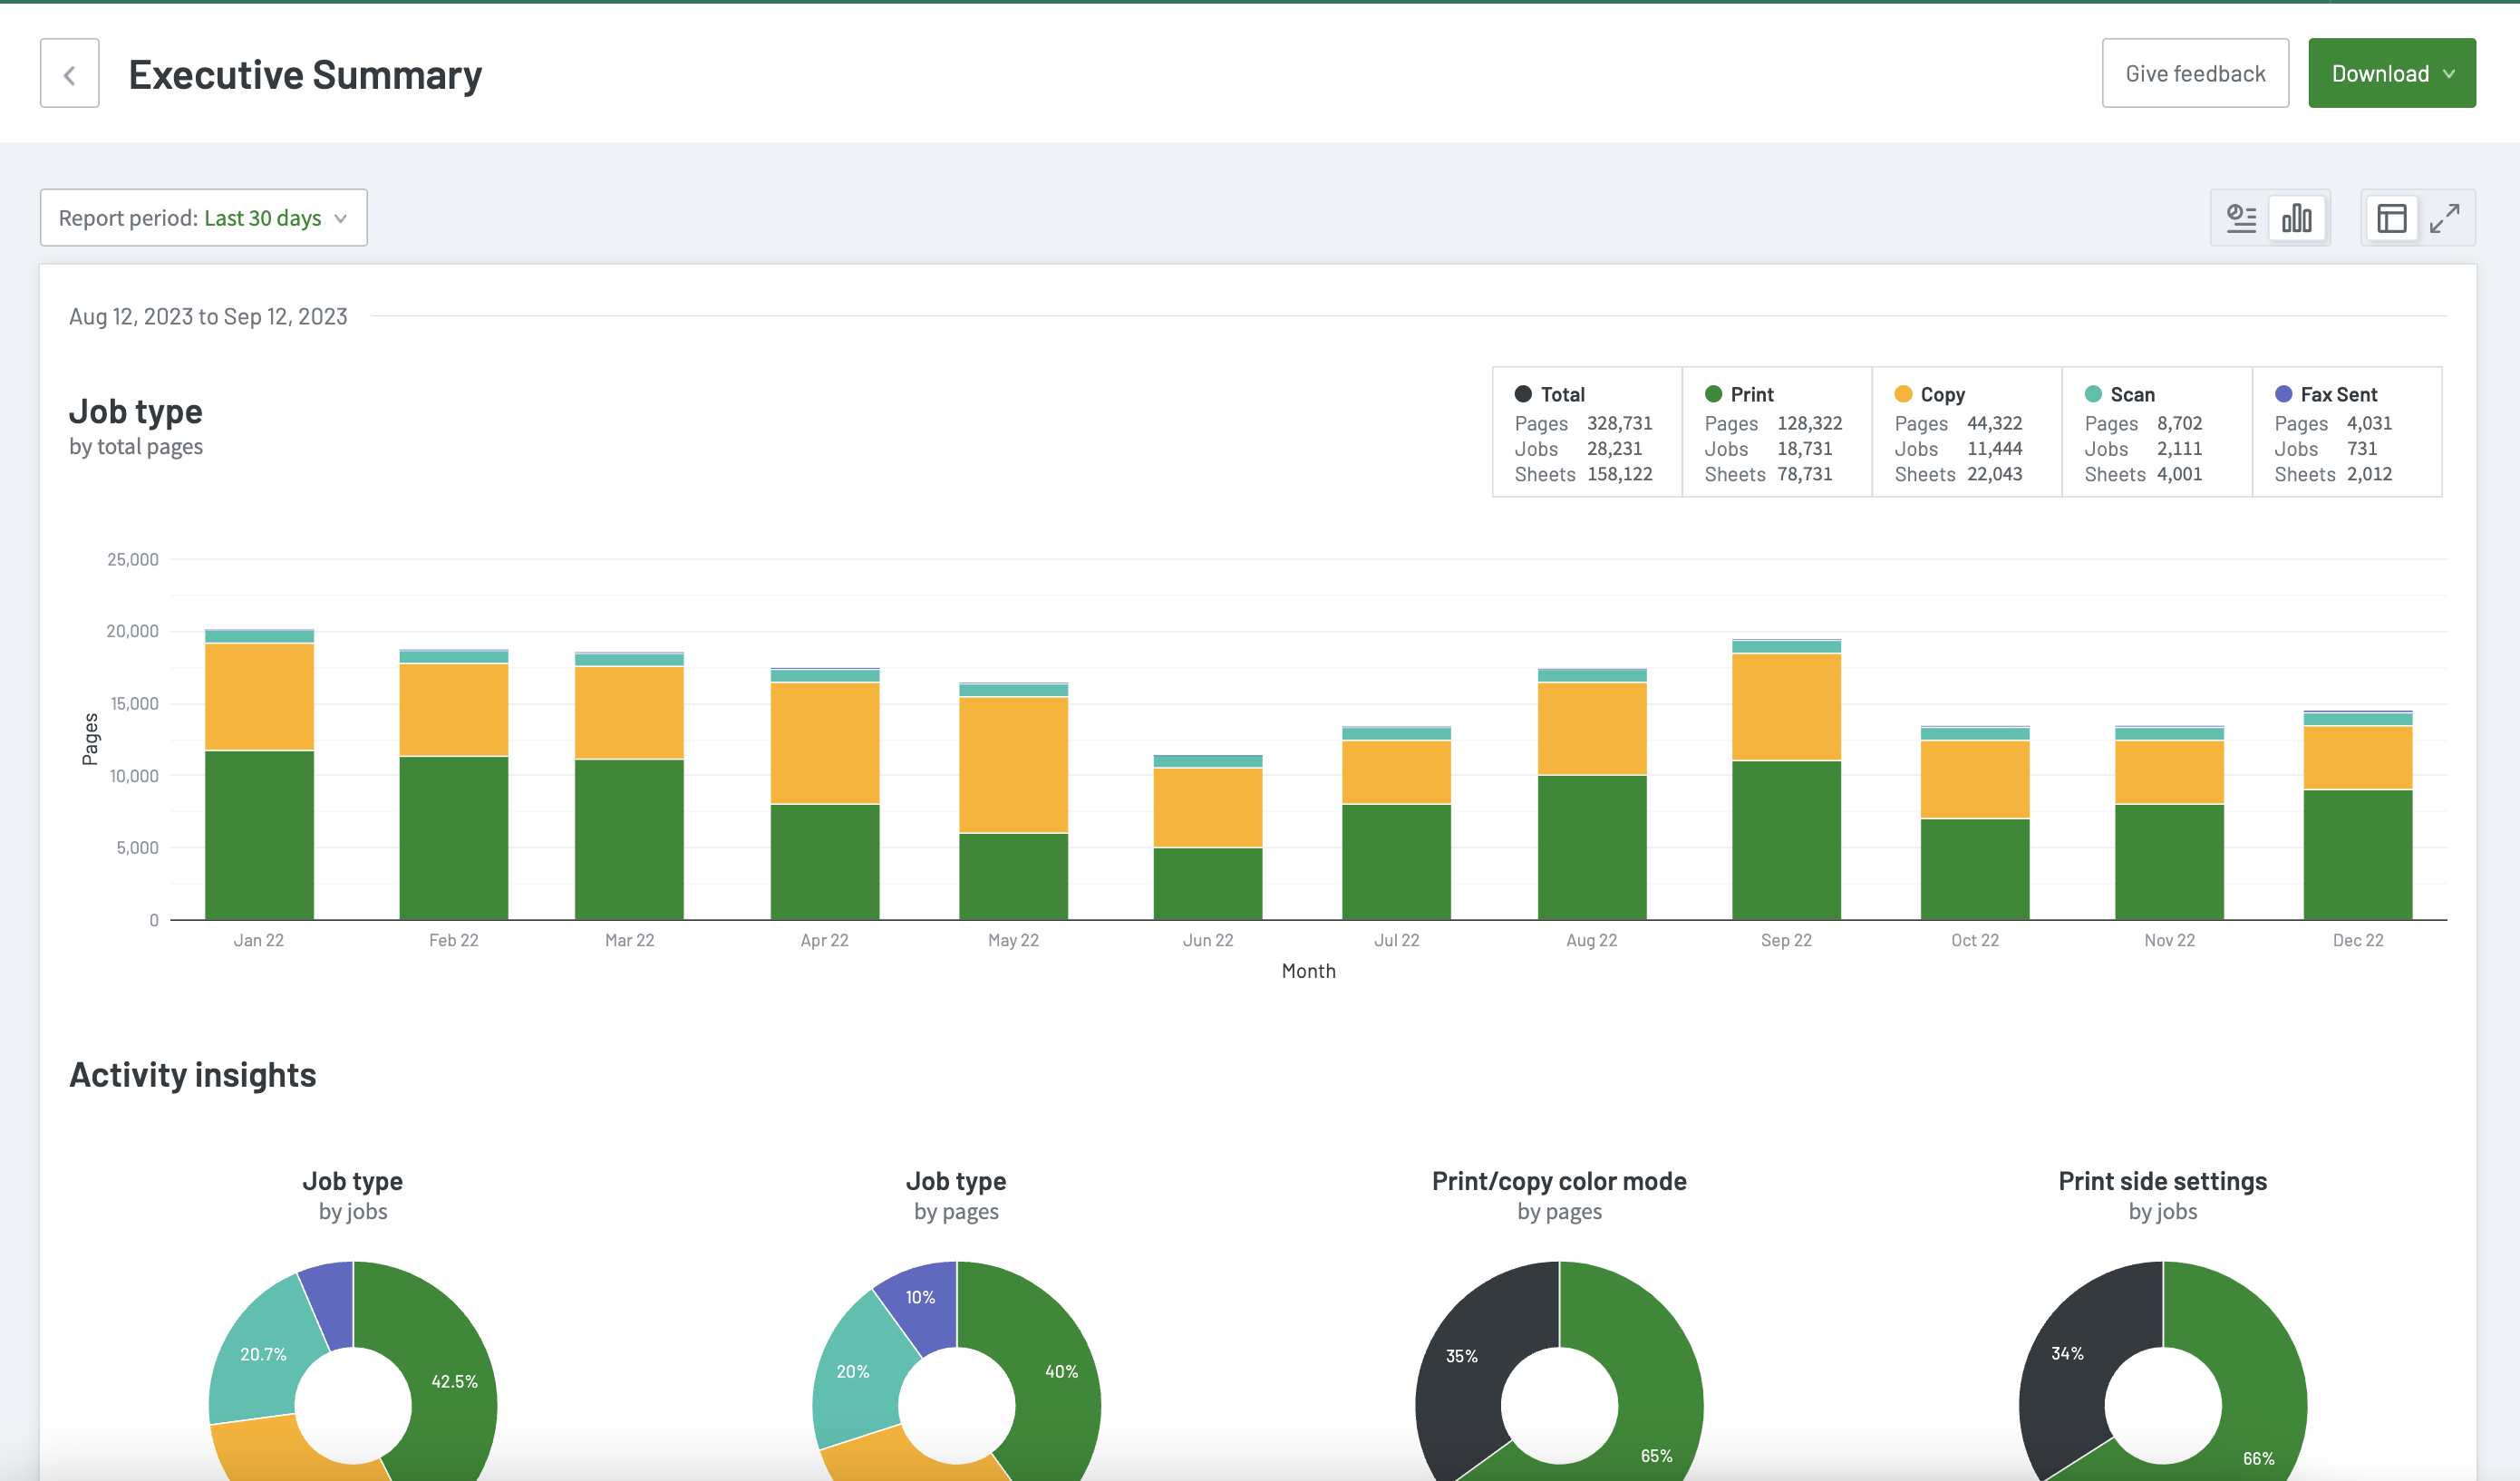
Executive Summary report
In PaperCut Hive and Pocket, reports can visually represent print, copy, scan, and/or fax data in a bar chart or tabular format.
We offer a range of reports, including user-friendly, pre-built reports you can create with just one click.
Accessing and previewing reports
To access reports, in the admin console main menu, in the EXPLORE section click Reports.
To get a sense of each report, click the thumbnail image in the list. A sample report and description are displayed.
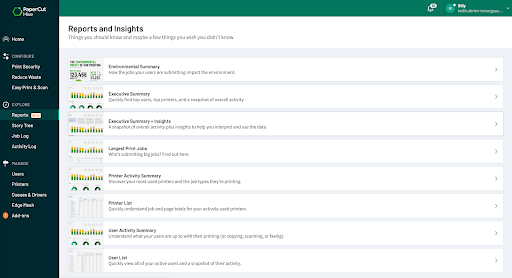
List of available reports
| REPORT | INSIGHTS | | — | — | | Environmental Summary | See how the jobs your users are submitting impact the environment. | | Executive Summary | Monitor the overall printing situation with this quick snapshot of job types, color mode, paper side settings, user activity, and printer use. | | Executive Summary + Insights | View all the goodness of the Executive Summary report with extra insights and tips. Use this version to understand how to use and apply the data to help manage printing at your organization. | | Largest Print Jobs | Discover all the information you need about a print job, scan, or copy job - including who, when, and where. | | Printer Activity Summary | Discover your most-used printers and the job types they’re printing. | | Printer List | Understand job and page totals for your actively used printers. | | User Activity Summary | Understand your users, their activity, and who prints what. | | User List | View all of your active users and snapshots of their print activity. |
Report format
Reports are in the CSV format. Use the CSV reports to access the data in plain text format. This format is suitable for importing data into programs such as Microsoft Excel or Google Sheets.
Generating a report
To generate a report, simply select your desired report on the Reports and Insights page.
The report opens and automatically displays data from the last 30 days.
To change the date range, under the report tile click the Report period dropdown, select the date range, and click Apply.
If one of the common date ranges supplied in the list, such as Yesterday, Last 90 Days, and Last Year etc. isn’t suitable, you can always use the Custom option.
Exporting data
If a report is downloadable you’ll see a Download button at the top right of the report page.
To export your data, click Download, then click CSV as the file type. A CSV of your data will be downloaded to your PC/mobile device.
Viewing top printers and top users
Top printers
The Printer Activity Summary report lists the activities for your top 100 printers. If you would like to view data for all of your printers, view the Printer List Report.
Top users
The User Activity Summary report lists the activities of your top 100 users. If you would like to view data for all of your active users, view the User List report or the Activity Log.
Viewing the most- and least-used printers
The Executive Summary report lists your 5 most-used and 5 least-used printers
If you want to dig into the activity of a specific printer, view the Printer List report or the Activity Log.
Viewing which users print the most and the least
Users who print the most
The Executive Summary report lists your top 10 users.
If you want to dig into the activity of a specific user, view the User List report or the Activity Log.
Users who print the least
The User List report details all of the print activities for every user who prints in your organization.
To identify who’s printing the least, download the CSV data and use Excel or Google Sheets to sort the data from descending to ascending for the activity that you are interested in, for example, Print, Copy, Black and White etc.
Viewing user account transactions
The Transaction log is available to organizations that have enabled Cost Tracking (in the admin console > Reduce Waste > Cost Tracking).
The transaction log shows all transaction records associated with changes to user account balances. These changes can be:
- Print jobs and copy jobs with costs that are deducted from the user’s Balance.
- Manual adjustments to the user Balance made by an admin (such as adding to a user’s balance when the user notifies the admin that they’ve reached $0).
- Automatic adjustments in the user Balance made by an automation (such as a scheduled quota adding $5 per month to the user’s balance).
A maximum of 100 transactions are displayed in the Transaction log. To get the full data set, download the CSV file.
Differences between the Transaction log report and CSV download
# | Columns | In Transaction Log report | In CSV | Notes |
|---|---|---|---|---|
1 | Date | ✔️ | ✔️ | When the transaction was settled. |
2 | User | ✔️ | ✔️ | This is the user’s Full Name. If Full Name is blank, then it’s populated with the user’s email address. If there are users with the same full name, the name is clickable on the report, which will take you to the user detail tab. The CSV export contains extra unique identifier columns for the users in columns User ID and User Email. |
3 | Target account | ❌ | ✔️ | Currently this will always be Default, which is the user’s default personal account. In the future, when the product introduces more types of accounts, this column will be made visible in the Transaction log report. |
4 | Account type | ❌ | ✔️ | Currently this will always be Personal, which is the user’s default personal account. In the future, when the product introduces more types of accounts, this column will be made visible in the Transaction log report. |
5 | Transacted by | ✔️ | ✔️ | Shows who or what caused the balance to change (a job, a manual adjustment by an admin, or an automatic adjustment by a scheduled automation). |
6 | Transaction type | ✔️ | ✔️ | Shows type of transactions such as:
|
7 | Amount | ✔️ | ✔️ | The amount of the transaction. Can be positive or negative, according to the transaction type. |
8 | New balance | ✔️ | ✔️ | The resulting balance after the transaction. |
9 | System note | ✔️ | ✔️ | These are notes from the system, not entered manually by a person. Currently shows the name of any quota scheduled automation (more options will be available in the future). |
10 | Comment | ✔️ | ✔️ | Displays any transaction comment optionally entered by the admin. Where a comment is added to a scheduled quota during setup, it will appear each time the quota automatically runs. |
11 | User ID | ❌ | ✔️ | The backend user ID in the product. Useful if the user has changed their name. |
12 | User Email | ❌ | ✔️ | The user’s email address. Useful to help distinguish between users who have the same full name. |
13 | Transaction ID | ❌ | ✔️ | This is the backend transaction ID in the product. Useful if any help (such as contacting PaperCut Support) is needed with a specific transaction. |
14 | Job ID | ❌ | ✔️ | Can be used as the reference column to link this CSV file’s data to CSV exports from the Job Log, such as using Microsoft Excel;’s VLOOKUP or XLOOKUP formulas. |
Environmental Summary report - calculations explained
We use various environmental statistics figures to estimate the impact that your paper usage has had on the environment. The statistics include:
- trees worth of paper used
- carbon emitted to produce the amount of paper used
- energy used to produce the amount of paper used.
To provide these statistics, PaperCut uses figures based on cited sources. For example, to calculate the number of trees consumed PaperCut performs the simple calculation: paper used x pages per tree = trees consumed.
The meaning of the reported values and how they are calculated are detailed below.
Trees | This value corresponds to a percentage of a tree that has gone into making the paper. The value assumes that the user is printing on standard A4 or Letter sheets and that 8,333 sheets make up a tree. |
Carbon | This value corresponds to greenhouse gases released in the production of the paper (CO2 equivalent). The value assumes that the user is printing on standard A4 or Letter sheets and one sheet equals 12.7g CO2. This amount is equal to 2.5 metric tons of CO2 carbon equivalents per metric ton of paper. |
Phone charges | This value represents the energy used to charge a smartphone. The energy value is represented by relating it to the equivalent energy consumed by a charging a smartphone. This provides users with a real-world understanding of the value. This value assumes that 7.84g of CO2 are produced every time a smartphone charged. |
Comments